In this post, we will learn how to use the demo version of IDA Pro to disassemble, debug, and crack a simple crackMe software. You may download a copy of crackMe here. Simply unzip, load into IDA Pro, and follow along.
After unzipping the target binary and running it

In our scenario, we have a piece of software that is asking for a passphrase or key to unlock it. Since we don’t know the correct passcode, the software exits with a “wrong password” message. All is not lost. This is the power of reverse engineering and using tools such as IDA Pro’s disassembler and debugger: we don’t need the source code to learn how the software works. With just a debugger and a disassembler, we can often extract keys and learn a lot about the our target software.
After installing your IDA demo. Double-click to the IDA demo icon and you should see a window like below:
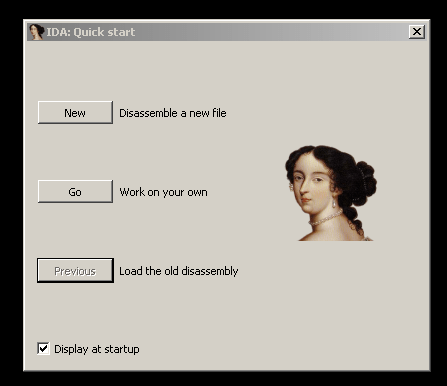
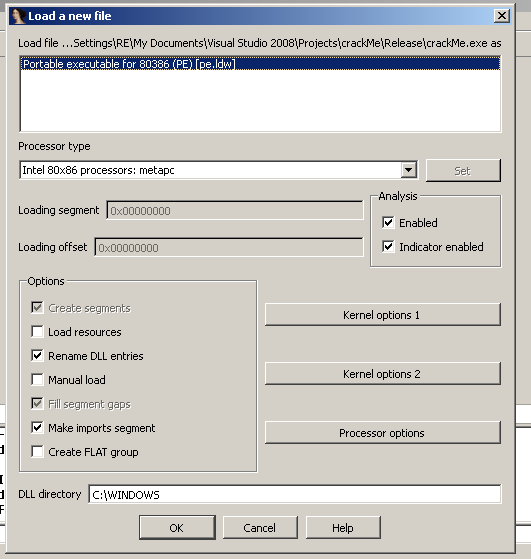
Select the “New” button and then open your crackMe binary:

Then click Ok on the “Load New File” Window:

IDA will ask if you want to switch to “proximity view now”, simply click the “No” button. You should see a window similar to the screenshot below:

At the very top is the navigation band. It gives a layout of the binary as loaded in the virtual address space of memory. The dark blue bands refer to code or functions written inside the binary. The light blue bands refer to functions that come from a library (e.g. the C run time library), and the pink area refers to Windows APIs that are loaded by Dynamic Link Libraries (DLLs).
The boxes on the left side contain a function window and a graph overview window. Both can be used to quickly navigate to areas of code that might be interesting to investigate. The middle window contains a call graph of the entire binary. You can change from this call graph view to a flat source code view by hitting the space bar. The space bar will toggle back and forth between call graph view and flat view.
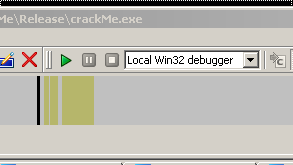
Before examining the source code, let us first set up IDA’s debugger. In the menu bar, select Debugger, then at the dialog box, select the Local Win32 debugger.

Once the debugger is set, the green debugging arrow should be activated.

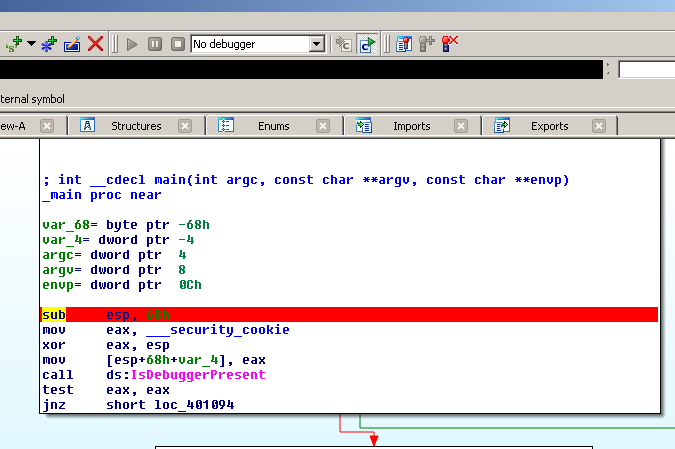
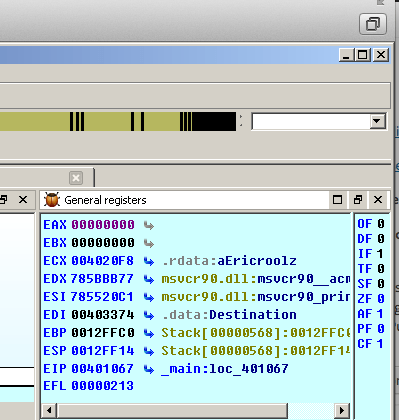
Before we begin debugging, lets navigate around the code to find some interesting landmarks. Right at the start, we can see a call being made to a Windows API, IsDebuggerPresent. According to the Microsoft Developers Network documentation, this function determines if the calling process, i.e. crackMe, is being debugged by a user-mode debugger. It sets EAX to 1 if the calling process is being debugged. It sets EAX to 0 if the calling process is not being debugged. If we were to start the IDA debugger (green arrow button or hit F9 key), crackMe simply exits. So we will have to deal with this common anti-debugging technique.
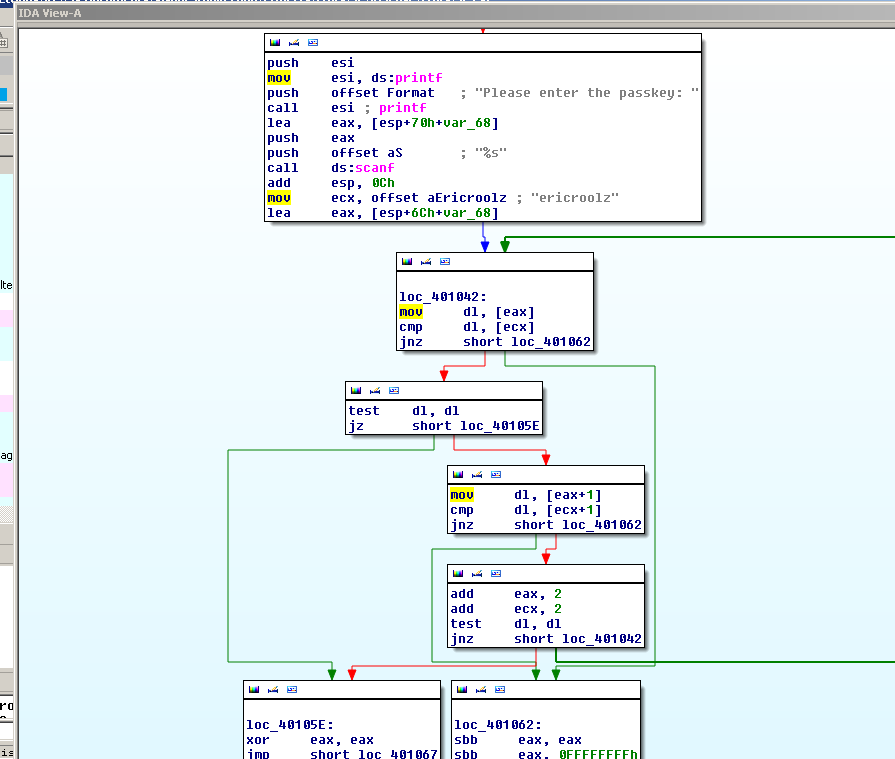
Scrolling down a little ways, we see what looks to be a command prompt asking for the passphrase and then some sort of comparison routine. Note the hard-coded string that is moved into the ECX register:

It looks like this comparison routine is comparing the user’s command line input to the hard-coded string “ericroolz”.

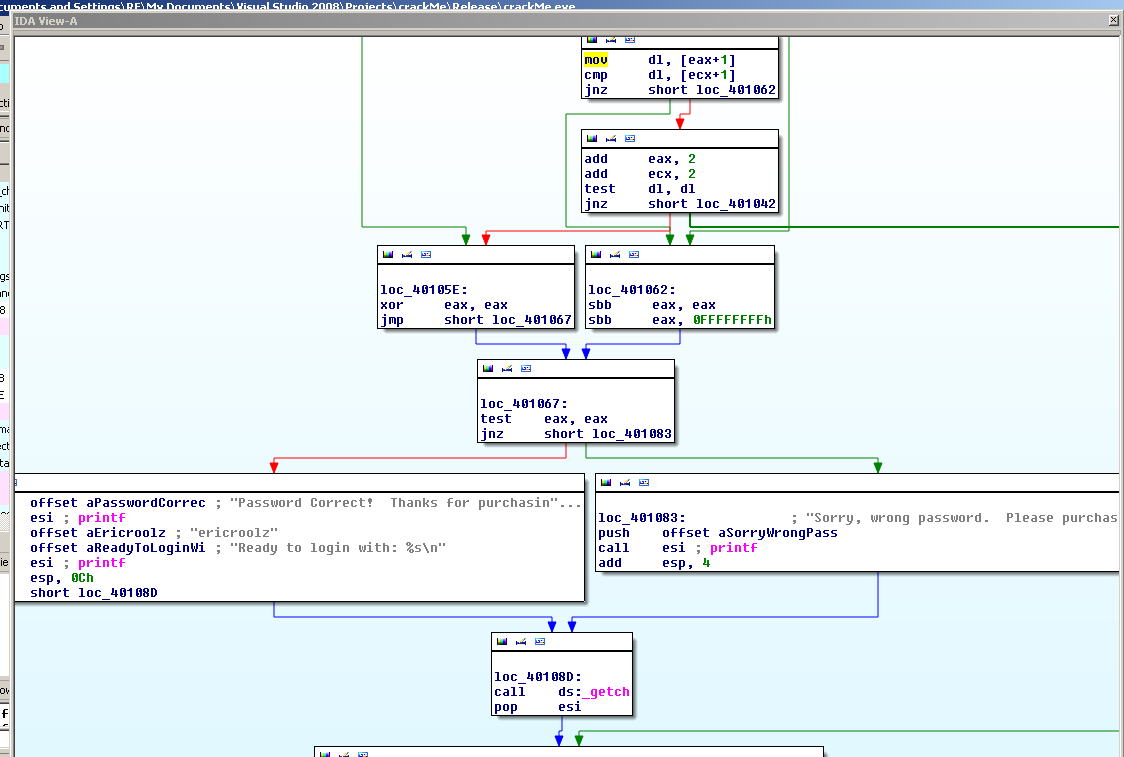
Just by static examination, we managed to extract the passphrase. We can test that by running crackMe from the command line and typing in “ericroolz” and we should get the “Correct password” message. That is one way to defeat this example. But suppose we did not see the passphrase, perhaps it was obfuscated or encrypted, or buried in thousands of thousands of lines of code. All is not lost, we can use IDA’s debugger to step to this crucial decision point:

Then we can manipulate the results of EAX or the JNZ command to always take the path to the correct password message. But first, we are going to have to deal with the IsDebuggerPresent check at the start of this code. First, lets set a break point at the very start of the program, like in the screenshot below (hit the F2 key and you will see a red band indicating the break point is set):

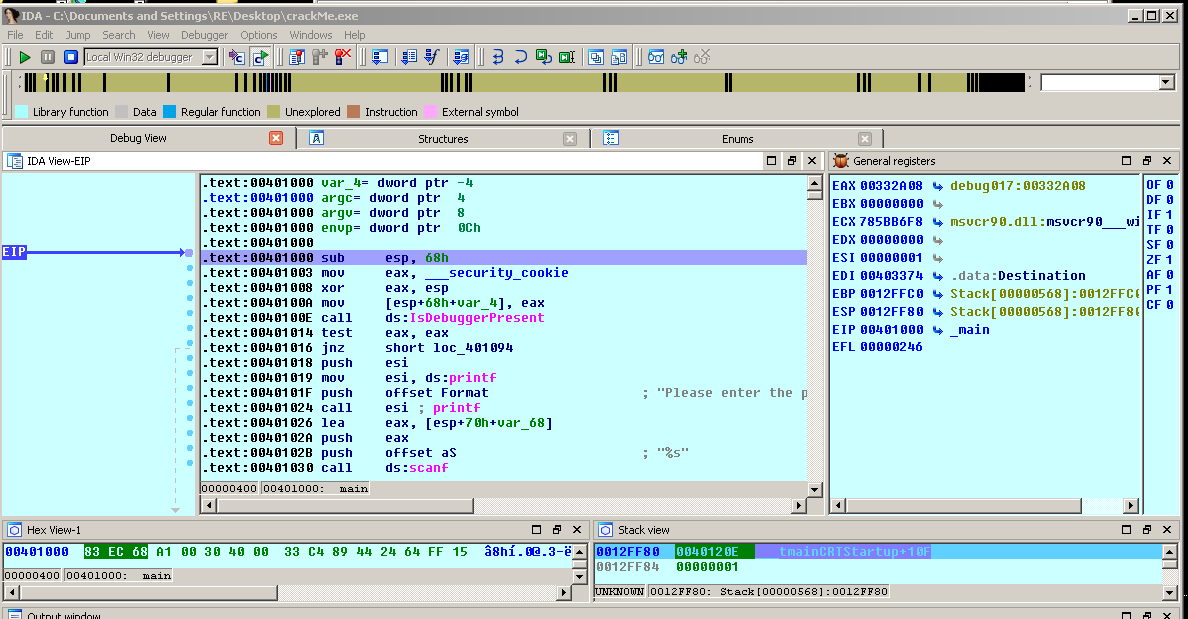
Now hit run or F9. We should break:

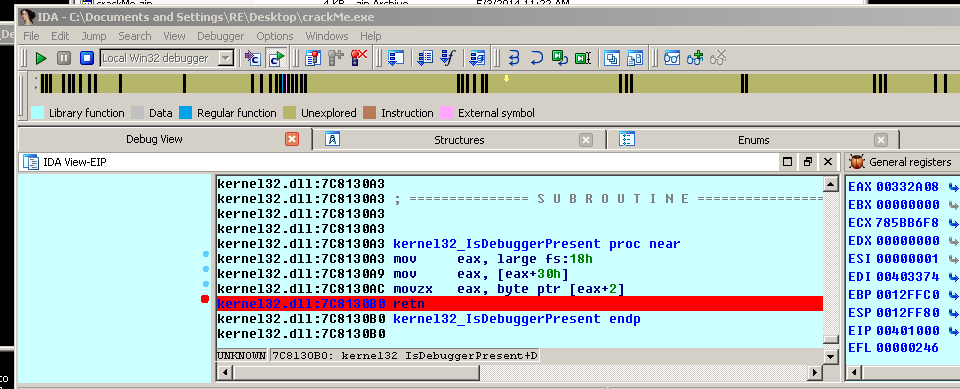
While we are at this break, hit the ‘G’ key and type “kernel32_IsDebuggerPresent” in the resulting dialog box. It is important to have the kernel32 and the underscore along with the IsDebuggerPresent):

you should wind up here:

Next, set a break point (F2) at the “retn” instruction at address 7C8130B0:

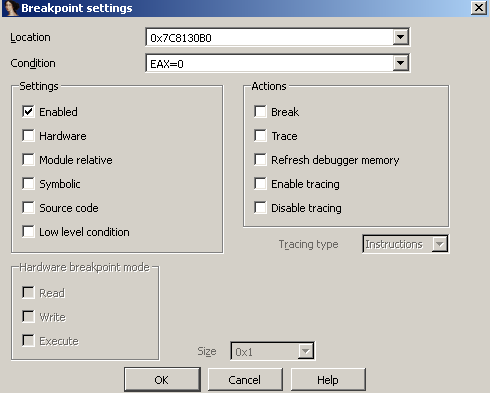
Right-click on that break point and select “Edit Breakpoint”. In the resulting dialogbox, you want to set the condition of EAX=0 and unselect the Break (under Actions) check box. Next click OK:
 ,
,
We are setting the break point in such a way that we are not suspending the program when we hit the break point, but simply setting the return value (stored in EAX) from IsDebuggerPresent to always be 0, that is, regardless of the fact that we are running crackMe in IDA’s debugger, the condition will always return false and we will fool the program into continuing with our debug session.
Next, hit the ‘G’ key again and type in ‘eip’ in the box. This will take us back to our current break point, that is, to where the current instruction pointer is pointing to:

Next, we are going to want to navigate to that crucial decision point we saw earlier during our static analysis:
So let us go to loc_401067 and set a break point there. We can use the ‘G’ key and type in the address to take us there:

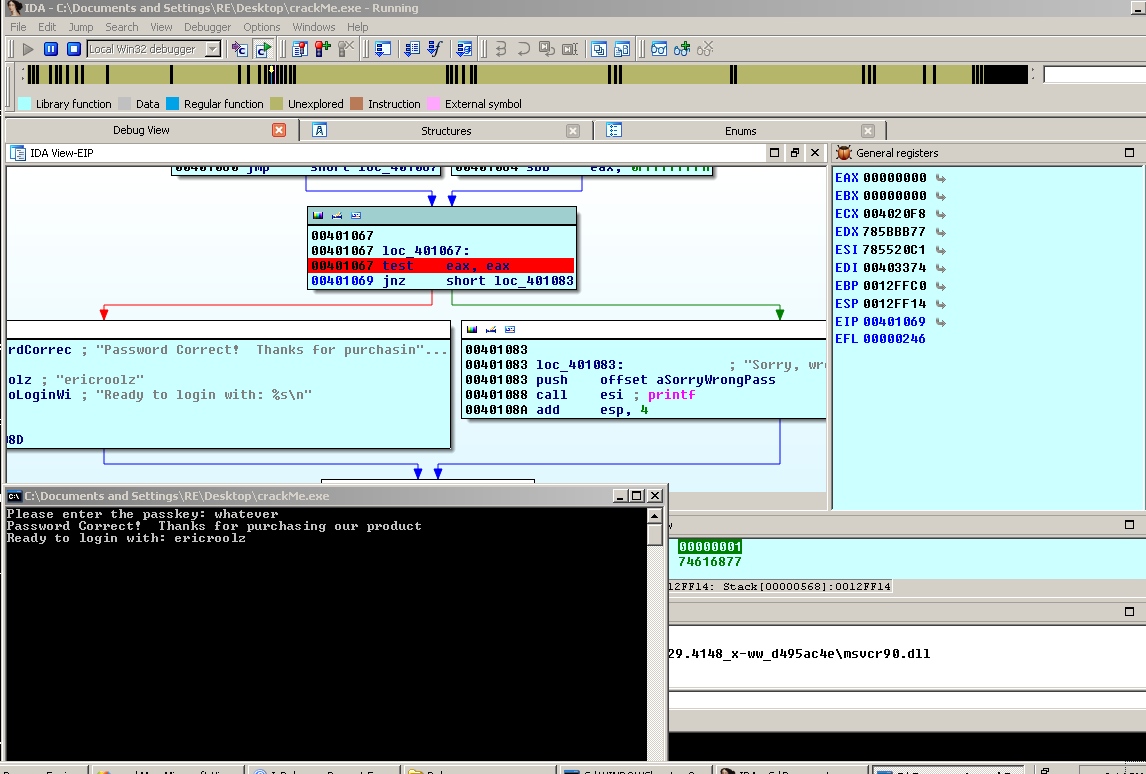
Now after hitting F9 again, the debugger runs to this break point we just set. Open the resulting command window and enter any passphrase you want (I typed in “whatever” then hit the enter key):


After typing any phassphrase, we hit the breakpoint. Note the value in the EAX register. It is a 1. The TEST EAX, EAX instruction is checking whether EAX is 0 or not. Since it is 1, the JNZ command will jump us to the incorrect password message. We don’t want that. We can do one of two things:
1. We can change the value of EAX by highlighting the EAX register, right clicking and choosing the “Zero value”. This will change EAX to 0 and we will take the path to the correct password message.
2. We could step past the TEST EAX, EAX instruction and pause on the JNZ instruction. If EAX was 0, the TEST instruction would set the zero flag (ZF = 1) but since what I typed in won’t match “ericroolz” either, the zero flag will not be set (ZF=0). We can simply change the zero flag by right clicking on the ZF value and choosing “Increment value”. This will increment the ZF to 1 from 0, thus causing the JNZ instruction to take the correct password message.
I will demonstrate method number 1. You may re-run this example and try method 2 if you wish. Right-clicking on the EAX value:

We will just 0 out EAX:
Note that the EAX value changed to 0 and if we single step past the TEST instruction:

You should see the red arrow pointing to the correct password message blinking. That signifies that we will take that path after setting EAX to 0. If we continue to run the debugger (F9) we should see that even though we clearly entered the wrong key, we still were able to “unlock” our program:

Now that we know the crucial decision point, we could use an editor such as OllyDbg and change the JNZ instruction to something that will always jump to the correct message location no matter what passphrase is typed in.
Although, this example was rather simple, it does illustrate the power of using a disassembler and a debugger. Even though we do not possess the source code, that did not prevent us from learning how our target binary worked. Once we understood how our binary worked, we were able to manipulate it into “unlocking” itself.