Relativity Applies to Software Installation?

Tags

,

Does time slow down when I install or upgrade software?  I have never met anyone or anything so overly optimistic than installation software telling me an installation will only take a few minutes:

Screen Shot 2016-05-22 at 10.41.06 AM

Its been “less than a minute” for the past ten minutes!  Come on, man!!!!

The best way to get a project done faster is to start sooner

— Jim Highsmith

The Journey of 238,857 Miles Begins with A Single Step

Tags

, , , , ,

Last week, I was at the Smithsonian Air and Space Museum.  Every time I visit, I find something very inspiring:

IMG_0688

These are Astronaut Eugene Cernan’s spacesuit accessories.  Gene Cernan left the last human footprints on the moon in December 1972 (Apollo 17).  If you look closely, you can see the lunar dust that still coats these boots.  For a moment, there was only 6 inches of plexiglass separating me from articles that left this planet and set foot on the moon.  Wow!

I have seen that famous photo of the footprint on the moon:

footprint_thumb

Courtesy of NASA

Now I saw a pair of boots that made the last human footprints on the lunar surface.  This moment made me think: from now on I will use the word “impossible” with greater care.  At one time a footprint on the moon was considered impossible.  With the power of science and human ingenuity, we can make the impossible possible.

Reverse Engineering with OllyDbg

Tags

, ,

OllyDbg is a 32-bit disassembler/debugger for Microsoft Windows binary files.  It is shareware and it is available here.  The goal today is to provide a tour of OllyDbg and how the tool can be used in reverse engineering software or malware.  We will learn many of Olly’s features while attempting to unlock a “trial” software whose trial time has expired.

Prerequisites

  • You should have a good understanding of Intel x86 assembly opcodes; not how to program but at the very least, know how to it.  You will also need the following tools:
  • OllyDbg v1.10
  • CFF Explorer.  Available here.

And if you want to follow along, I created a simple little CrackMe program that you can download from here.

A Tour of OllyDbg

The following figure shows the various components inside the OllyDbg debugger:

OllyDbg

Figure 1: OllyDbg’s Debugging EnvironmentThe following figure gives the “lay-of-the-land” inside the debugger and its various components.

The Window with the disassembly and byte-code instructions is called the CPU window, there is a window that shows the current register settings and the EFLAGs register settings, the hints pane will display useful information such as register or address values while single-stepping through the code, you can always view the memory contents of data and registers in the memory view window, and the stack window shows the current stack setup during your debugging session.  Also note that OllyDbg “speaks” Windows API and will resolve any API information, arguments, and strings in the CPU window next to the op-codes.

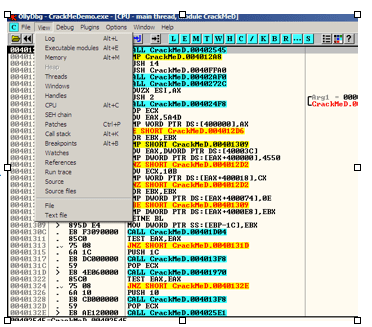
OllyDbg View Menu and Windows
OllyViewMenu

Figure 2: Menubar -> View

OllyDbg’s View menu will open new windows to view a process’ threads, handles it has open, its layout in memory and breakpoints.  Note that many of the view menu items have hot-key commands.  For example, the key sequence of Alt+B will open the Breakpoints window to view all of the breakpoints set in your debugging session.  You may also call up many of the view menu options by clicking on the corresponding blue buttons (L, E, M, T, etc).

OllyLogWindow

Figure 3: Log Window

Clicking on the Log (Alt+L) option will bring up the Log Window.  This window displays all debugging events such as module loads, thread creations, breakpoint hits, and errors.  If you need to do some trouble-shooting during your debugging session, the Log Window may be useful in tracking down unusual or unexpected behaviors while stepping through mal-code.  The Log window is also useful in checking to ensure any plug-ins you installed were loaded correctly.  Any plug-in loading errors can usually be attributed to placing the plug-in in a directory other than Olly’s default plug-ins directory.  Two recommended plug-ins you should get are OllyDump to dump a process’ memory and Olly Advanced to get around any anti-debugging a malware sample may throw against you.  The OllyDump plug-in will come in handy during manual unpacking and it contains two heuristics for locating the OEP (Original Entry Point).  OpenRCE (www.openrce.org) has OllyDump, Olly Advanced, and many other useful plug-ins to help hide the debugger from malware attacks or to help automate your dynamic analysis process.

OllyExecutableWindow

Figure 4: Executable Modules Window

OllyNamesWindow

Figure 5: Names Window

The Executable Modules Window shows the base virtual address, the virtual size (the size the binary takes up in memory), the Entry Point’s virtual address, the module name, file version, and file path for each module loaded in the process.  Red text means that the module was loaded dynamically.  While in this window, right-clicking on a module opens a context menu.  Choosing the “View names” (Ctrl-N) opens the Names Window.  The Names Window shows the list of imported and exported functions for a given module.  Examining a malware’s imported functions may give a general idea of the malware’s functionality.  For example, if you see functions opening an internet connection and downloading files from an URL, the sample may be a downloader.  The MSDN API documentation site (www.MSDN.microsoft.com) is a useful resource in looking up these functions to learn what they do, the parameter’s these functions take in, and what these functions return.
While in the Names window, you can right-click on any of these functions names to toggle a break point (Right-click -> “Toggle breakpoint” or press the F2 key).  This allows you to set breakpoints on API functions.  For example, many malware will use the API IsDebuggerPresent to check if they are being debugged and attempted to kill the debugger.  Setting breakpoints on these API’s will help you navigate quickly to those parts of code that have anti-debugging checks so you can defeat them.

OllyDbg’s Memory Map window shows the virtual address, the virtual size, the owner module, section names, memory allocation type and memory protection for each allocated region of memory in the process.

OllyMemMapWindow

Figure 6: Memory Map Window

OllyDbg’s Threads window shows the thread ID, Entry Point virtual address, the Thread Environment Block (TEB) virtual address, the last-error value, status such as, active or suspended, the priority, and the timing information for each thread in the process.

The Windows window displays the Handle, Title, Parent Window, Window ID, Window Style, and Window Class Information for each window owned by the process.

The Handles window shows the object type, reference count, access flags, and the object name for each handle owned by the process.

The SEH (Structured Exception Handler) chain window shows the Structured Exception Handler functions for the current thread.  See the figure below for the Threads, Windows, Handles, and the SEH windows.

Figure 7: The Threads, Windows, Handles, and SEH windows

Figure 7: The Threads, Windows, Handles, and SEH windows

OllyDbg has a Call Stack window that is very useful in observing the call stack for the current thread.  The Stack window shows the virtual address of stack frame for each function call, the stack contents at that virtual address, the procedure and its arguments as pushed on the stack, as well as who called the procedure.

Figure 8: The Call Stack Window

Figure 8: The Call Stack Window

And finally, the Breakpoints window shows all the user-set software breakpoints in the process.

OllyBreakPoints

Figure 9: Breakpoints Window

The window shows the virtual address of all software breakpoints currently set, the active status (always, disabled), and the disassembly instruction of the breakpoint.  You can right-click on this window to disable or delete the breakpoints that have been set.

OllyDbg Hotkeys

There are several hotkeys that you will find useful during your debugging session.  They are:

  • F7 – the Step Into command.  This key single-step traces one instruction at a time
  • F8 – the Step Over command.  This key single-step traces one instruction except for CALL instructions.  When used on a CALL, F8 sets a breakpoint after the CALL and runs the debuggee.  This is handy for stepping over C-runtime libraries, such as printf, scanf, etc.
  • F9 – Run runs the debuggee
  • F2 – Set Breakpoint sets a software breakpoint on the currently selected instruction.

Other OllyDbg Functionalities

In OllyDbg’s menu bar, the Debug menu allows you to set both hardware and software breakpoints, single step instructions, restart the debugging session, perform conditional tracing , or to set commandline arguments for the debuggee.
OllyDbg has many context menus.  You can right-click on almost anything in OllyDbg to get a context menu to examine your many debugging options.

Reversing with Olly

With our tour of Olly behind us, we are now ready to start doing some real work: reversing and cracking a “trial” piece of software.  First, it is usually a good idea to configure OllyDbg to ignore exceptions and to show loops.  In the OllyDbg menu bar, go to Options, then Debugging Options:
In the Exceptions tab, make sure your settings look like Figure 10.

Figure 10: Configure Olly to Ignore Exceptions

Figure 10: Configure Olly to Ignore Exceptions

To set the “Ignore also following custom exceptions or rages:” select the check-box and then click the add range button.  In the top dialog box type eight 0’s (00000000) and in the second type eight F’s (FFFFFFFF).

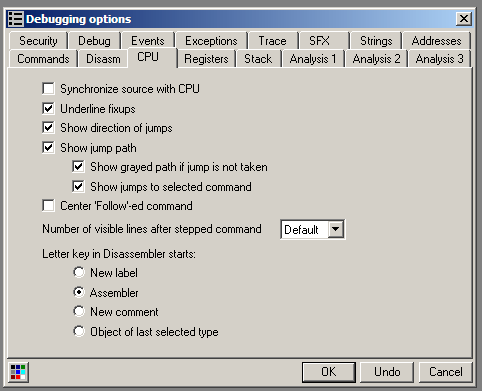
Next click on the CPU tab and make sure the boxes highlighted in Figure 11.
DebuggingOptionsLoops

Figure 11: Debugging Options to Show Loops

Meet the Debuggee

To demonstrate the power and functionalities of OllyDbg, we will use a sample that has some copy protections.  Say we downloaded a trial piece of software that expires after a certain date or after 30 days.  As you can see in Figure 12, the following “trial” software is expired and no longer working.  All we get is an error message when we attempt to execute it.

Figure 12: Software Trial has Expired

Figure 12: Software Trial has Expired

The first thing we should do is assess the software with CFF explorer to identify the development language used and some other particulars.

Figure 13: CFF Explorer

Figure 13: CFF Explorer

CFF explorer has some built-in functionalities to calculate the MD5 and SHA-1 hashes of our sample.  Dependency Walker lists the DLL’s this sample relies on, and we can see that the sample was compiled with Visual Studio C++ 8, which is Visual Studio 2013.  Since we have a native executable, tools such as ILSpy, ILDASM, and Reflector can’t be used to analyze this sample’s opcodes.  We will need to rely on OllyDbg.

Open the CrackMeDemo.exe program in OllyDbg.  In the menu bar, select File then open to navigate to the location of CrackMeDemo.exe.

Figure 14: Opening CrackMeDemo in Olly

Figure 14: Opening CrackMeDemo in Olly

Olly will disassemble the binary file and it will look something like Figure 15.  After disassembly, Olly will take us to the entry point, which for this sample is at virtual address 0x40129E.  At this point, the question we are now faced with is where to begin?  We could scroll through this sample’s opcodes and look for the error message we encountered but that could be tedious if there are thousands of lines of code.  Instead, we will use the power of the debugger to help us locate the error message.

By hitting F9 to run the debugger, we should encounter the error message as seen in Figure 16.  Now we will attempt to find the time limit checking code.  Next press F12 to pause the debugging execution.  Note the yellow “Paused” message in the debuggee status.  With the execution paused, we now can search for the code that causes the error message.

Figure 15: CrackMeDemo at Entry Point

Figure 15: CrackMeDemo at Entry Point

One way to look for our error message is to examine the current call stack since the error message is currently displayed at this point.  To view the call stack, press Alt+K.  From this vantage point you can easily see that the error message string is a parameter of the MessageBoxA function call (see Figure 17).
Select the USER32.MessageBoxA near the bottom of the call stack.  Then right-click and choose “Show Call” (see Figure 18).  This will take us to the starting point in the CrackMeDemo’s software where the call to USER32.MessageBoxA is made (Figure 19 ).

Figure 16: Running the debuggee

Figure 16: Running the debuggee

Figure 17: The Call Stack Window (Alt+K)

Figure 17: The Call Stack Window (Alt+K)

Figure 18: Show Call

Figure 18: Select Show Call

Figure 19: The Start of MessageBoxA call in debuggee

Figure 19: The Start of MessageBoxA call in debuggee

Notice at the line highlighted in Figure 19 the “>” symbol.  This “>” symbol indicates that other parts of code jumps to this location.  Notice in the API information section in Figure 19 shows the MessageBoxA call and its parameter’s just above it.  The parameters start with the PUSH 10 instruction at 0x401042.  Since we are at the PUSH 10 instruction (indicated by the grey line), we can examine the Hints pane to see the parts of code that references this call:

Figure 20: The Hints pane shows two places that jump to this error message box

Figure 20: The Hints pane shows two places that jump to this error message box

Select the text area of the hints pane and right-click to open a context menu.  It allows you to easily navigate to the code where those jumps are made:

Figure 21: Context menu of hints pane

Figure 21: Context menu of hints pane

We see two jumps, a JNZ from 0x401060 and a JE from 0x401064.  Now we can modify those parts of the code.  Select the JNZ from 0x401060 from the context menu.  This will take you to the jump command at 0x401060.  In order to prevent the program from hitting this error code path, we can change the jump instruction to a NOP (no operation) instruction.  Right click on the instruction at location 0x401060 inside the CPU window and select “Binary” and then click on the “Fill with NOPs” as shown in Figure 22.

Figure 22: Binary patching with NOPs

Figure 22: Binary patching with NOPs

The operation overwrites the JNZ instruction with NOPs, thus eliminating that code path (or jump) to the error message.  Next go back to the PUSH 10 instruction of the MessageBoxA by pressing the minus sign key (-) and repeat the process for the JE from 0x401064.

Figure 23: the JNZ instructio is filed with NOPs

Figure 23: the JNZ instructio is filed with NOPs

Once your two jumps to the error message are patched with NOPs, save the modifications by right-clicking in the CPU window, click on “Copy to Executable”, and then select “All Modifications.  Hit the “Copy all” button in the resulting dialog box as shown in Figure 24 and Figure 25.

Figure 24: Copy to Executable -> All modification

Figure 24: Copy to Executable -> All modification

Figure 25: Resulting Dialog Box after Figure 24

Figure 25: Resulting Dialog Box after Figure 24

After selecting the “Copy all” button, a new window appears as in Figure 26.  Right click on this file window and choose “Save File” as in Figure 27.

Figure 26: The CrackMeDemo file window

Figure 26: The CrackMeDemo file window

Figure 27: Saving our changes

Figure 27: Saving our changes

I renamed our fixed CrackMeDemo software and saved it to the desk top.  Double clicking on our new, patched binary should result in:

Figure 28: Success!

Figure 28: Success!

Conclusion

Today we learned our way around OllyDbg and used that information to debug, reverse, and defeat an expiration lock of a “trial” piece of software.

About me: I teach Reverse Engineering and Reverse Engineering of malware at Sandia National Laboratories in Albuquerque, New Mexico.  I also consult with several University Computer Science Departments on how to develop a reverse engineering course.  If you liked this post, feel free to share it with others who may be interested in learning the art of reverse engineering.


The Value of Algorithmic Problem Solving: A Demonstration

Tags

, , ,

Algorithmic problem solving is a very useful skill to develop.  Once such source you can learn and practice these skills is [1].  Allow me to illustrate with an example with puzzle #29, p. 39 from [1]:


 Magic Squares

A magic square of order 3 is a 3×3 table filled with nine distinct integers from 1 – 9 so that the sum of the numbers in each row, column, and corner-to-corner diagonals is the same.  Find all the magic squares of order 3.


image1According to the tutorial on p. 4 of [1], solving this problem is not difficult if we can prove that the common sum must be 15 and that 5 must be placed at the center square.  We should start with these two hints and see where that knowledge takes us.

1.  What should be the common sum?  We have nine distinct integers: 1, 2, 3, …, 9, of which, each sum is a combination of three of those distinct integers.  The sum of the digits 1 to 9, i.e. 1 + 2 + 3 + … + 9 = 45.  Since we are only using three of the digits to form our sum for each row, column, and the diagonals, we divide 45 by 3: 45/3 = 15.  Hence the common sum of any of the three squares — rows, columns, and diagonals — must be 15 because the total sum of all nine digits in the magic square will be 45.

2. Which integer should occupy the center square to get an optimal sum of 15 using the remaining integers?

image2 Start with 9: if 9 occupied the center square, then an 8 will have to occupy any one of the eight remaining boxes.  The sum of 8 + 9 = 17 and 17 > 15 so that won’t work.  The same problem occurs if 8 occupies the center square because a 9 must occupy one of the remaining boxes adjacent to the 8.

Let x, y, and z be any one of the distinct integers in the set of consecutive integers 1 through 9.  We need x + y + z = 15.  Observe that x+y = 15 – z, x+z = 15 – y, and y+z = 15 – x.  Since addition is commutative, x+y = y+x, x+z = z+x, and y+z = z+y.  Hence, x+y < 15, x+z < 15, and y+z < 15.  Since 9 cannot occupy the center, that means 9 will occupy any of the remaining squares, which means x+9 < 15* for all integers in the set of consecutive integers from 1 to 8.  The first such integer to satisfy this condition is 5, i.e. 5+9 = 14 < 15.  Hence, 5 must occupy the center square.

Given our new constraint, we know that 1+5+9 = 15:

image3

image4What about the diagonals?  Say we had the arrangement on the left.  Take the rows containing the 1: x+y+1 = 15.  The only remaining digits to satisfy the equation have to be 6 and 8, i.e. 6+8+1 = 15.  Note that the 6 or the 8 would wind up in the same row as the 9.  In either case, 8+9 = 17 > 15 and 6+9 = 15 leaving the remaining square unfillable.  Given the symmetric nature of squares, we can reason that none of the diagonal 1,5,9 combinations will work.  Given our further constraint, this reduces the possible partially filled squares to one of the four above, which I have labeled (a), (b), (c), and (d).

In the case of (a): for the row containing the 1, our only options are the digits 6 and 8 to make the 15.  These can be placed in either combination:

image5

The remaining digits can then be uniquely positioned to create our magic square.

For case (b), given the symmetric properties of squares, we can obtain our solutions by swapping the top and bottom rows from our solutions to case (a):

image6

Case (c) can be constructed in a similar fashion to case (a):

image7

And again using the symmetry of squres, we can take the case (c) solutions by swapping the first and third columns to obtain a solution for case (d):

image8

for a total of 8 magic squares of order 3!

Q.E.D


What I learned by solving the magic square puzzle:

To exhaustively search all possible 3×3 tables by placing a 1 in one of the possible nine locations, a 2 in any of the possible eight locations remaining, a 3 in any of the possible 7 locations left, and so on, means the total possible combinations would be:

9! = 9x8x7x…x1 = 362,880

ways to arrange the 9 numbers in a 3×3 table.  That is an undaunting task to generate all 362,880 tables checking if the result of our arrangements yields a magic square.  Considering that we just learned there are only 8 such squares of order 3, that is a lot of wasted work.

In order to improve our exhaustive search, we tried constraining our problem to help reduce the search space.  One such discovery was the invariant of the common sum of 15.  This invariant was helpful in allowing us to smartly construct magic squares that fit the constraint.

We further reduced our search space by discovering another invariant: that 5 must always occupy the center square.  Given these two invariant properties, we were able to quickly and smartly reason all the possible magic squares of order 3 without having to waste our time constructing and examining the 362,872 squares that did not fit the constraints.

Bottom line:  Invariants are incredibly useful in problem solving and programming.  Finding an invariant can reduce intractable exhaustive search problems and ensure that our solutions are correct.  The recognition of invariants is an important problem solving skill.  Possibly the most important.


* Note that 9 could be x, y, or z but the results from any of the inequality relationships will be the same.  Therefore, we will show the x+9 < 15 relationship but our “proof” will hold with any of the three inequality relationships.

References

[1] Algorithmic Puzzles, Anany Levitin, Maria Levitin, Oxford University Press, Inc., New York, NY, 2011

You are the one

I have been traveling a lot lately and that means eating at a lot of restaurants. I was alone and at every restaurant when waiting to be seated, the hostess would say in an almost condescending tone, “Just one!?” Even my own hotel, the hostess asks, “Just one!?” As if I had the audacity to patronize their restaurant without bringing a group. I’m sorry. I wasn’t aware that it was my responsibility to attract customers for you. Finally, I got tired of it. On the my last morning at the hotel restaurant, the hostess again asks, “just one!?” I replied, “No. Not just any one. I am THE one. And I would like breakfast, please.”

The moral: don’t let anyone belittle you because you deviate from the pack. There is nothing wrong with individuality; being solo; alone. It is ok to be a party of one, or — to steal an ad slogan — an army of one. In the age of social media, we forget that it is ok to opt out of doing what everyone else is doing. It is ok to do your own thing; be your own self. Being unique is what separates you from me and me from you. It’s an asset that you can use to compete against everyone else claiming to be “above average.” You may be “just one”, but you are not just anyone. You are the only one who is you. All of us are born unique. Our uniqueness is encoded in our genetic make up. A genetic sequence that has never been seen before in the universe — and will never be seen again. You and I are “one hit wonders”. Your job then, your purpose on this earth, is to become who you are by learning who you are. You are the one and you can do it.

An Interesting “Gotcha” in C

Tags

, , , , , , ,

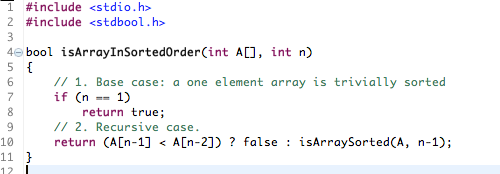
Consider the following function:

Screen Shot 2014-08-19 at 2.57.34 PM

The function takes an array and uses recursion to check if that array is in sorted order.  For example, an array containing: {1, 2, 3, 4} is in sorted (ascending) order.  So is the array: {2, 2}, or an array with only one element, such as: {0}.  But the array: {44, 3, 25, 88} is not.  A pretty simple, elegant, little function, right?  But, there is a potential danger.  Can you spot the problem?

I have been doing a lot of C programming for a project this summer (C is a customer requirement) and I have run across lots of libraries, and functions similar to the one above.  Namely, some function passing in an array, then iterating over the values of that array to print the contents or perform some computation over the elements.  In C, if you pass in an array as a function argument, you must also pass in the number of elements or size of the array.  Why?  In C, array parameters are treated as pointers and with out n, the size or number of elements contained in the array, we have no way of calculating the size of an array given its pointer.

A common mistake made by inexperienced C developers is to do:Screen Shot 2014-08-19 at 3.27.11 PM

That only works if you are dealing with arrays that are NOT received as parameters.  An array passed in as a parameter is treated as a pointer, the sizeof function will return the pointer’s size instead of the array’s.  Not what we want.

The potential danger of the function above, and consequently many functions that take in arrays (at least in C that I have noticed), is the assumption that the caller will do the right thing.   But accidents happen.  What happens when a caller passes in an array that is smaller than the size (e.g. isArrayInSortedOrder(A[2], 5) )?  We wind up exceeding the bounds of the array and crash the program and that belongs in the “bad things” category.

So how does one perform some form of sanity check when passing in an array and a size?  Don’t use C, use C++ or Java where array objects natively “know” their size?  Would if I could but customer constraint, remember?  Must be in C.  Convince the customer not to use C?  Fine, but what if you are developing on an embedded system?

Ok so we are stuck with C, a non-reflective language where objects don’t automatically know about themselves like their sizes.  One solution: we could write a macro to wrap the call, calculate the size of the native array before passing it in as a parameter, then adding our calculated size as a parameter.  That way, the caller would only need to pass in the array and not have to worry about getting the size right.  Something like the following:

Screen Shot 2014-08-19 at 3.55.00 PM

Notice the #define on line 15.  We name our wrapper function with one parameter in terms of our original but slightly modified array checking function.   The size of the native array is calculated first and then passed in as the second parameter, the int n.  One other note:  obviously a developer can see the original function declaration and there is nothing preventing the developer from calling that function directly bypassing my wrapped solution.  We would need to do a better job of “hiding” the original.  But for demonstration purposes, this will suffice.

In our modified implementation, we can add some sanity checks to deal with empty arrays or if n becomes a negative number for some weird reason:

Screen Shot 2014-08-19 at 4.02.30 PM

By wrapping our function in a macro, we simplify the implementation a bit for the user. They only have to pass in an array and the wrapper will calculate the size on behalf of the caller thus potentially minimizing our risk of passing in an incorrect array size.

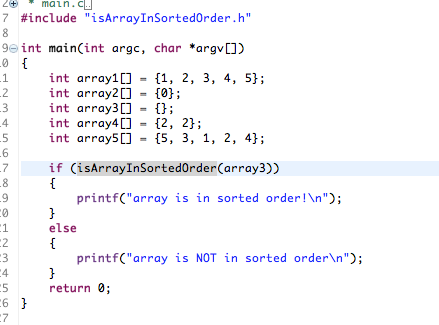
To test our solution, we can do:

Screen Shot 2014-08-19 at 4.12.21 PM

Since array3 is empty, the above should print that the array is not sorted.  Change the array parameters and you should find that arrays 1, 2, and 4 should print that the arrays are sorted, while array 5 is not sorted.

An interesting little conundrum in C that I never really put much thought into until I started doing more intensive C programming projects.  I would be interested in hearing your thoughts on handling situations like the above, or others gotchas.  Feel free to drop me a line.  Until next time, we’ll C you later.

An Ode to a Trying Week

Tags

, , , ,

Things don’t seem to be going well for me this week; can’t seem to kick the endless meeting streak.

Projects delayed and problems reared their ugly heads; customer ripped my report to shreds.

Corporate bureaucracies wore me to a nub; my presentation was an utter flub.

No, I did not seem to get much done today; things came apart long before mid-day.

Yes, today was the day that tested my mettle; and I’ve endured many a nasty nettle; but I will not give in, nor sway, nor settle…  For tomorrow I will get back upon the saddle.

I choose to try again.

May the Fourth be with you

Tags

, , , ,

Today is the biggest geek holiday of the year.  A day when countless millions recall and share their favorite scenes and quotes from the “Star Wars” saga.  My all-time favorite quote comes from the “Empire Strikes Back”

Do or do not.  There is no try.

–Yoda Jedi Master (896 BBY – 4 ABY)

My second favorite:

Fear is the path to the dark side.  Fear leads to anger.  Anger leads to hate.  Hate leads to suffering.

Also from Yoda.  I would add that fear also leads to paralysis, inaction, and avoiding decisions.  Use today to heed the words and wisdom of Yoda.  Be the driving force of your own life and do.