OllyDbg is a 32-bit disassembler/debugger for Microsoft Windows binary files. It is shareware and it is available here. The goal today is to provide a tour of OllyDbg and how the tool can be used in reverse engineering software or malware. We will learn many of Olly’s features while attempting to unlock a “trial” software whose trial time has expired.
Prerequisites
- You should have a good understanding of Intel x86 assembly opcodes; not how to program but at the very least, know how to it. You will also need the following tools:
- OllyDbg v1.10
- CFF Explorer. Available here.
And if you want to follow along, I created a simple little CrackMe program that you can download from here.
A Tour of OllyDbg
The following figure shows the various components inside the OllyDbg debugger:
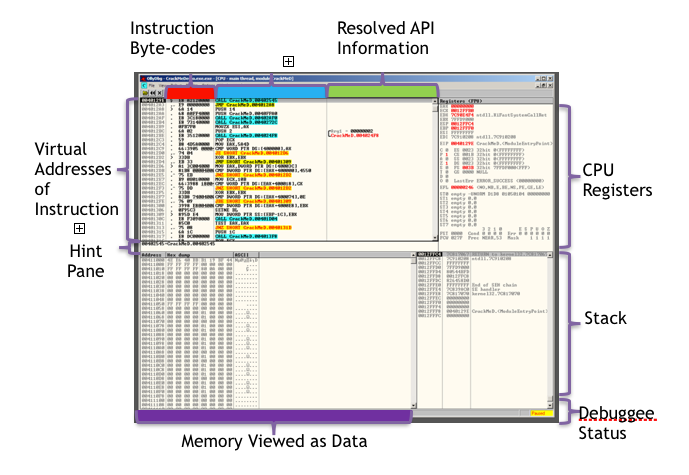
Figure 1: OllyDbg’s Debugging EnvironmentThe following figure gives the “lay-of-the-land” inside the debugger and its various components.
The Window with the disassembly and byte-code instructions is called the CPU window, there is a window that shows the current register settings and the EFLAGs register settings, the hints pane will display useful information such as register or address values while single-stepping through the code, you can always view the memory contents of data and registers in the memory view window, and the stack window shows the current stack setup during your debugging session. Also note that OllyDbg “speaks” Windows API and will resolve any API information, arguments, and strings in the CPU window next to the op-codes.
OllyDbg View Menu and Windows

Figure 2: Menubar -> View
OllyDbg’s View menu will open new windows to view a process’ threads, handles it has open, its layout in memory and breakpoints. Note that many of the view menu items have hot-key commands. For example, the key sequence of Alt+B will open the Breakpoints window to view all of the breakpoints set in your debugging session. You may also call up many of the view menu options by clicking on the corresponding blue buttons (L, E, M, T, etc).

Figure 3: Log Window
Clicking on the Log (Alt+L) option will bring up the Log Window. This window displays all debugging events such as module loads, thread creations, breakpoint hits, and errors. If you need to do some trouble-shooting during your debugging session, the Log Window may be useful in tracking down unusual or unexpected behaviors while stepping through mal-code. The Log window is also useful in checking to ensure any plug-ins you installed were loaded correctly. Any plug-in loading errors can usually be attributed to placing the plug-in in a directory other than Olly’s default plug-ins directory. Two recommended plug-ins you should get are OllyDump to dump a process’ memory and Olly Advanced to get around any anti-debugging a malware sample may throw against you. The OllyDump plug-in will come in handy during manual unpacking and it contains two heuristics for locating the OEP (Original Entry Point). OpenRCE (www.openrce.org) has OllyDump, Olly Advanced, and many other useful plug-ins to help hide the debugger from malware attacks or to help automate your dynamic analysis process.

Figure 4: Executable Modules Window
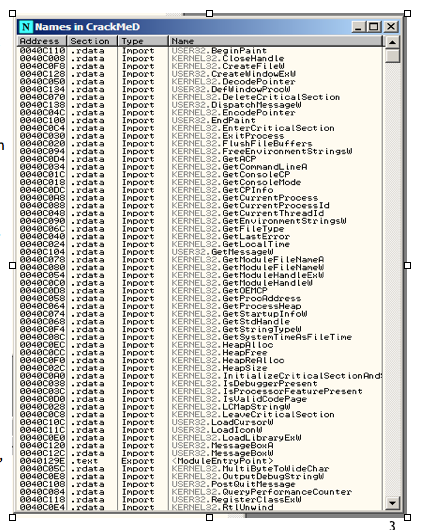
Figure 5: Names Window
The Executable Modules Window shows the base virtual address, the virtual size (the size the binary takes up in memory), the Entry Point’s virtual address, the module name, file version, and file path for each module loaded in the process. Red text means that the module was loaded dynamically. While in this window, right-clicking on a module opens a context menu. Choosing the “View names” (Ctrl-N) opens the Names Window. The Names Window shows the list of imported and exported functions for a given module. Examining a malware’s imported functions may give a general idea of the malware’s functionality. For example, if you see functions opening an internet connection and downloading files from an URL, the sample may be a downloader. The MSDN API documentation site (www.MSDN.microsoft.com) is a useful resource in looking up these functions to learn what they do, the parameter’s these functions take in, and what these functions return.
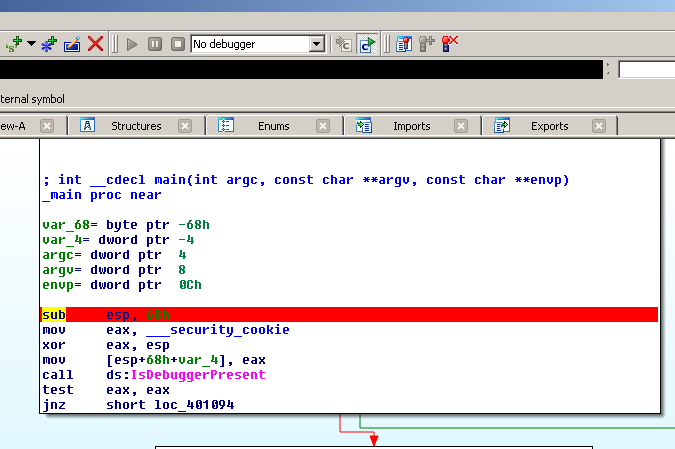
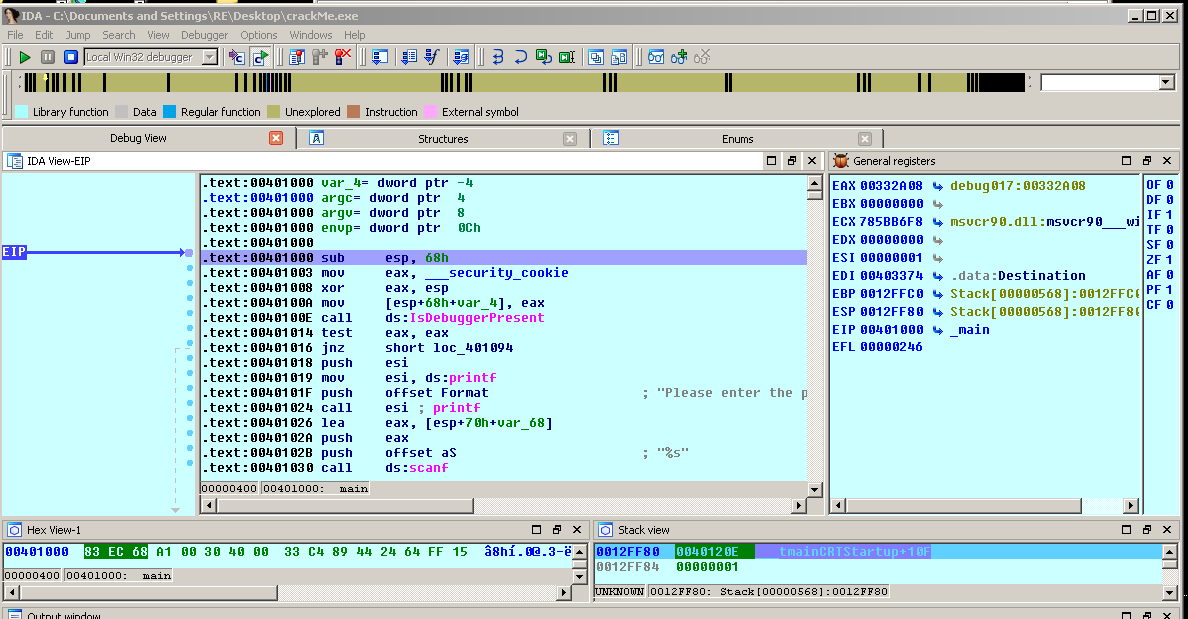
While in the Names window, you can right-click on any of these functions names to toggle a break point (Right-click -> “Toggle breakpoint” or press the F2 key). This allows you to set breakpoints on API functions. For example, many malware will use the API IsDebuggerPresent to check if they are being debugged and attempted to kill the debugger. Setting breakpoints on these API’s will help you navigate quickly to those parts of code that have anti-debugging checks so you can defeat them.
OllyDbg’s Memory Map window shows the virtual address, the virtual size, the owner module, section names, memory allocation type and memory protection for each allocated region of memory in the process.

Figure 6: Memory Map Window
OllyDbg’s Threads window shows the thread ID, Entry Point virtual address, the Thread Environment Block (TEB) virtual address, the last-error value, status such as, active or suspended, the priority, and the timing information for each thread in the process.
The Windows window displays the Handle, Title, Parent Window, Window ID, Window Style, and Window Class Information for each window owned by the process.
The Handles window shows the object type, reference count, access flags, and the object name for each handle owned by the process.
The SEH (Structured Exception Handler) chain window shows the Structured Exception Handler functions for the current thread. See the figure below for the Threads, Windows, Handles, and the SEH windows.

Figure 7: The Threads, Windows, Handles, and SEH windows
OllyDbg has a Call Stack window that is very useful in observing the call stack for the current thread. The Stack window shows the virtual address of stack frame for each function call, the stack contents at that virtual address, the procedure and its arguments as pushed on the stack, as well as who called the procedure.

Figure 8: The Call Stack Window
And finally, the Breakpoints window shows all the user-set software breakpoints in the process.
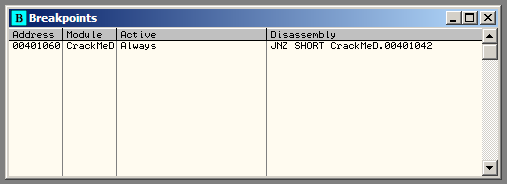
Figure 9: Breakpoints Window
The window shows the virtual address of all software breakpoints currently set, the active status (always, disabled), and the disassembly instruction of the breakpoint. You can right-click on this window to disable or delete the breakpoints that have been set.
OllyDbg Hotkeys
There are several hotkeys that you will find useful during your debugging session. They are:
- F7 – the Step Into command. This key single-step traces one instruction at a time
- F8 – the Step Over command. This key single-step traces one instruction except for CALL instructions. When used on a CALL, F8 sets a breakpoint after the CALL and runs the debuggee. This is handy for stepping over C-runtime libraries, such as printf, scanf, etc.
- F9 – Run runs the debuggee
- F2 – Set Breakpoint sets a software breakpoint on the currently selected instruction.
Other OllyDbg Functionalities
In OllyDbg’s menu bar, the Debug menu allows you to set both hardware and software breakpoints, single step instructions, restart the debugging session, perform conditional tracing , or to set commandline arguments for the debuggee.
OllyDbg has many context menus. You can right-click on almost anything in OllyDbg to get a context menu to examine your many debugging options.
Reversing with Olly
With our tour of Olly behind us, we are now ready to start doing some real work: reversing and cracking a “trial” piece of software. First, it is usually a good idea to configure OllyDbg to ignore exceptions and to show loops. In the OllyDbg menu bar, go to Options, then Debugging Options:
In the Exceptions tab, make sure your settings look like Figure 10.

Figure 10: Configure Olly to Ignore Exceptions
To set the “Ignore also following custom exceptions or rages:” select the check-box and then click the add range button. In the top dialog box type eight 0’s (00000000) and in the second type eight F’s (FFFFFFFF).
Next click on the CPU tab and make sure the boxes highlighted in Figure 11.

Figure 11: Debugging Options to Show Loops
Meet the Debuggee
To demonstrate the power and functionalities of OllyDbg, we will use a sample that has some copy protections. Say we downloaded a trial piece of software that expires after a certain date or after 30 days. As you can see in Figure 12, the following “trial” software is expired and no longer working. All we get is an error message when we attempt to execute it.

Figure 12: Software Trial has Expired
The first thing we should do is assess the software with CFF explorer to identify the development language used and some other particulars.

Figure 13: CFF Explorer
CFF explorer has some built-in functionalities to calculate the MD5 and SHA-1 hashes of our sample. Dependency Walker lists the DLL’s this sample relies on, and we can see that the sample was compiled with Visual Studio C++ 8, which is Visual Studio 2013. Since we have a native executable, tools such as ILSpy, ILDASM, and Reflector can’t be used to analyze this sample’s opcodes. We will need to rely on OllyDbg.
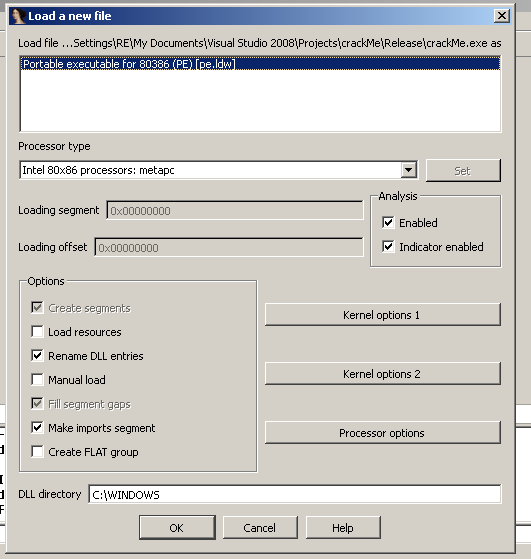
Open the CrackMeDemo.exe program in OllyDbg. In the menu bar, select File then open to navigate to the location of CrackMeDemo.exe.

Figure 14: Opening CrackMeDemo in Olly
Olly will disassemble the binary file and it will look something like Figure 15. After disassembly, Olly will take us to the entry point, which for this sample is at virtual address 0x40129E. At this point, the question we are now faced with is where to begin? We could scroll through this sample’s opcodes and look for the error message we encountered but that could be tedious if there are thousands of lines of code. Instead, we will use the power of the debugger to help us locate the error message.
By hitting F9 to run the debugger, we should encounter the error message as seen in Figure 16. Now we will attempt to find the time limit checking code. Next press F12 to pause the debugging execution. Note the yellow “Paused” message in the debuggee status. With the execution paused, we now can search for the code that causes the error message.

Figure 15: CrackMeDemo at Entry Point
One way to look for our error message is to examine the current call stack since the error message is currently displayed at this point. To view the call stack, press Alt+K. From this vantage point you can easily see that the error message string is a parameter of the MessageBoxA function call (see Figure 17).
Select the USER32.MessageBoxA near the bottom of the call stack. Then right-click and choose “Show Call” (see Figure 18). This will take us to the starting point in the CrackMeDemo’s software where the call to USER32.MessageBoxA is made (Figure 19 ).

Figure 16: Running the debuggee

Figure 17: The Call Stack Window (Alt+K)

Figure 18: Select Show Call
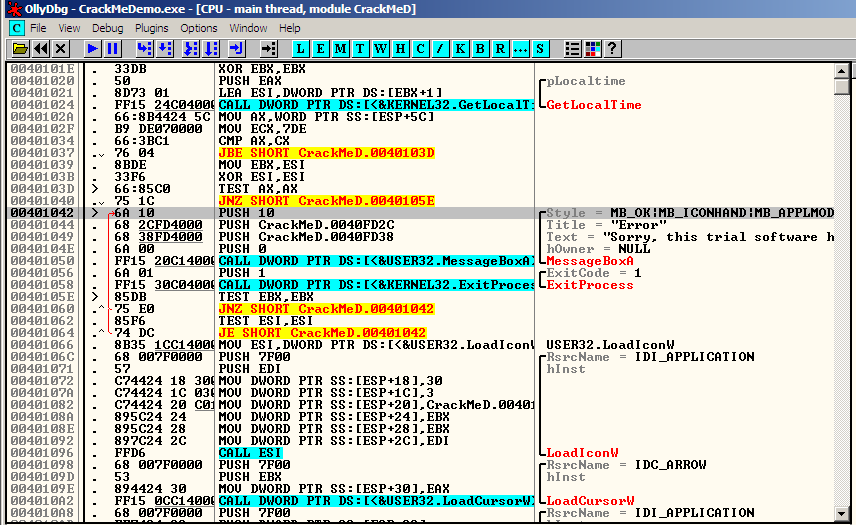
Figure 19: The Start of MessageBoxA call in debuggee
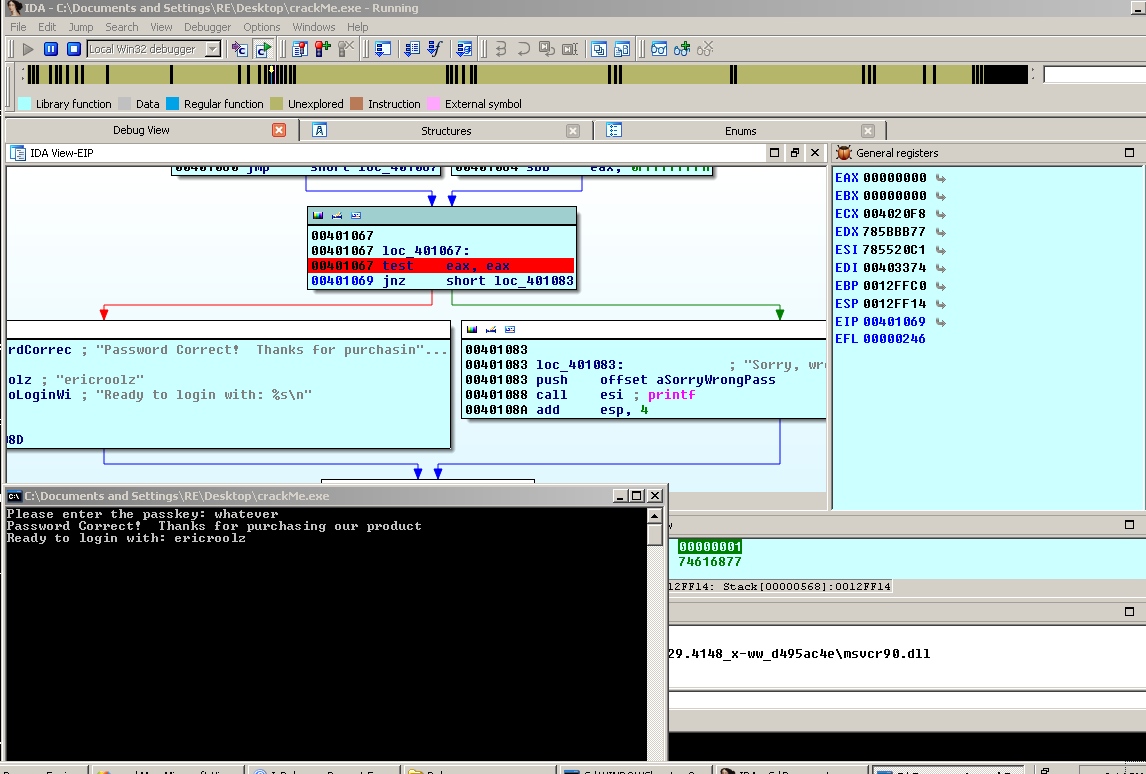
Notice at the line highlighted in Figure 19 the “>” symbol. This “>” symbol indicates that other parts of code jumps to this location. Notice in the API information section in Figure 19 shows the MessageBoxA call and its parameter’s just above it. The parameters start with the PUSH 10 instruction at 0x401042. Since we are at the PUSH 10 instruction (indicated by the grey line), we can examine the Hints pane to see the parts of code that references this call:

Figure 20: The Hints pane shows two places that jump to this error message box
Select the text area of the hints pane and right-click to open a context menu. It allows you to easily navigate to the code where those jumps are made:
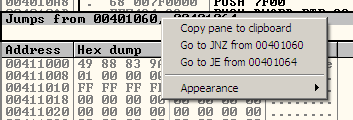
Figure 21: Context menu of hints pane
We see two jumps, a JNZ from 0x401060 and a JE from 0x401064. Now we can modify those parts of the code. Select the JNZ from 0x401060 from the context menu. This will take you to the jump command at 0x401060. In order to prevent the program from hitting this error code path, we can change the jump instruction to a NOP (no operation) instruction. Right click on the instruction at location 0x401060 inside the CPU window and select “Binary” and then click on the “Fill with NOPs” as shown in Figure 22.

Figure 22: Binary patching with NOPs
The operation overwrites the JNZ instruction with NOPs, thus eliminating that code path (or jump) to the error message. Next go back to the PUSH 10 instruction of the MessageBoxA by pressing the minus sign key (-) and repeat the process for the JE from 0x401064.
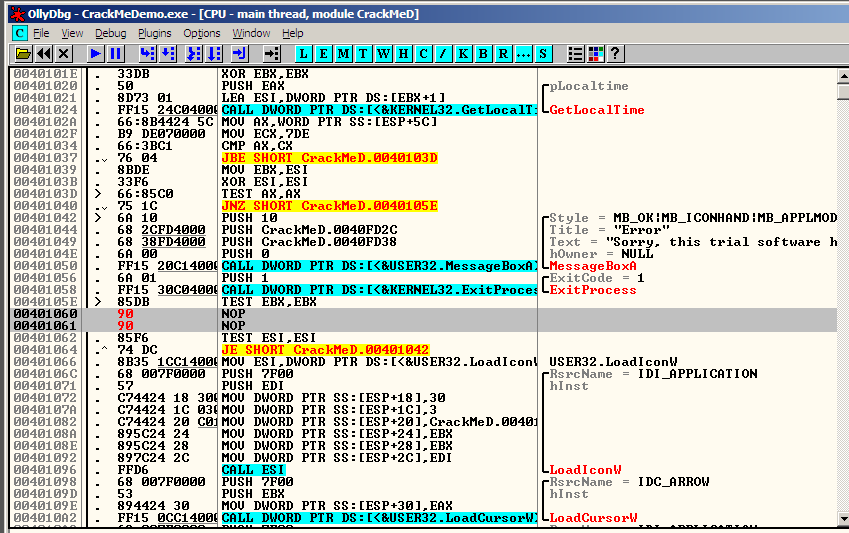
Figure 23: the JNZ instructio is filed with NOPs
Once your two jumps to the error message are patched with NOPs, save the modifications by right-clicking in the CPU window, click on “Copy to Executable”, and then select “All Modifications. Hit the “Copy all” button in the resulting dialog box as shown in Figure 24 and Figure 25.
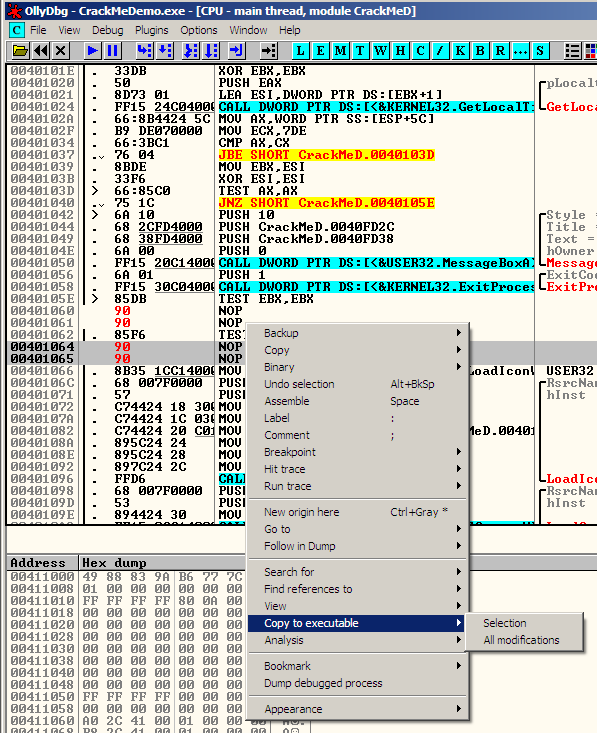
Figure 24: Copy to Executable -> All modification
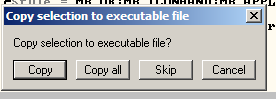
Figure 25: Resulting Dialog Box after Figure 24
After selecting the “Copy all” button, a new window appears as in Figure 26. Right click on this file window and choose “Save File” as in Figure 27.

Figure 26: The CrackMeDemo file window

Figure 27: Saving our changes
I renamed our fixed CrackMeDemo software and saved it to the desk top. Double clicking on our new, patched binary should result in:

Figure 28: Success!
Conclusion
Today we learned our way around OllyDbg and used that information to debug, reverse, and defeat an expiration lock of a “trial” piece of software.
About me: I teach Reverse Engineering and Reverse Engineering of malware at Sandia National Laboratories in Albuquerque, New Mexico. I also consult with several University Computer Science Departments on how to develop a reverse engineering course. If you liked this post, feel free to share it with others who may be interested in learning the art of reverse engineering.