
Tags
ESET ChallengeME 2013, Malware Analysis, Malware Reverse Engineering, Reverse Engineering, Reverse Engineering Puzzles
In part one of the ESET CrackMe 2013 challenge, we:
- Did some initial triaging and string analysis in order to try and deduce what the sample may do.
- We discovered that it was packed using a UPX packer.
- We unpacked the sample by hand using OllyDbg and ImportRec.
- Then analyzed the strings of our unpacked sample to see if we could now determine this samples potential capabilities.
Today, we are going to test our theory by actually running and debugging the EsteCrackMe3013 sample. Remember from part one, we did observe some indications of anti-debugging in our string analysis, so it is likely that we will have to try to circumvent those.
First, let’s load our unpacked CrackMe sample into IDA Pro and let it take us to the starting point of the program. A little ways down you can see a series of MOV instructions. This is a long block of move instructions, starting at 0x404679 and ending at 0x407A63:

These look like ASCII characters and if we highlight each character in IDA and hit the ‘r’ key, it will reveal the actual character:

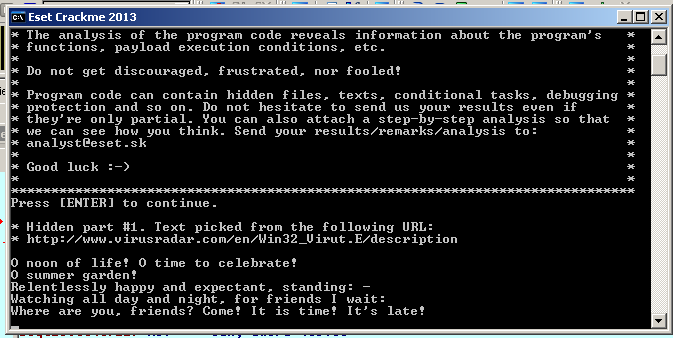
This looks like it might be the message we see printed to the console that we see when we first run the program:

I see an asterisk, some characters, and lots and lots of spaces. I could be hitting the ‘r’ key all day, and it appears that these characters are being loaded “randomly” into random locations. Perhaps they are scrambling the start up message to make static analysis harder. If we set a break point in IDA after all these MOV instructions, then highlight on of the move instructions, right click and jump in a new hex window, we can see:


And that is exactly what all those MOV instructions are doing. Moving the “scrambled” start up message into memory. It also explains why we were seeing lots of spaces.
At the end of the MOV instructions, if scroll down, we see calls to SetConsoleCursorPositon, SetConsoleTitle, and WriteConsole. This is the part of the code that retrieves the start up message lines from memory and prints them to the screen. Once we scroll past the routines that print the start message to the console, that is where things start getting interesting:
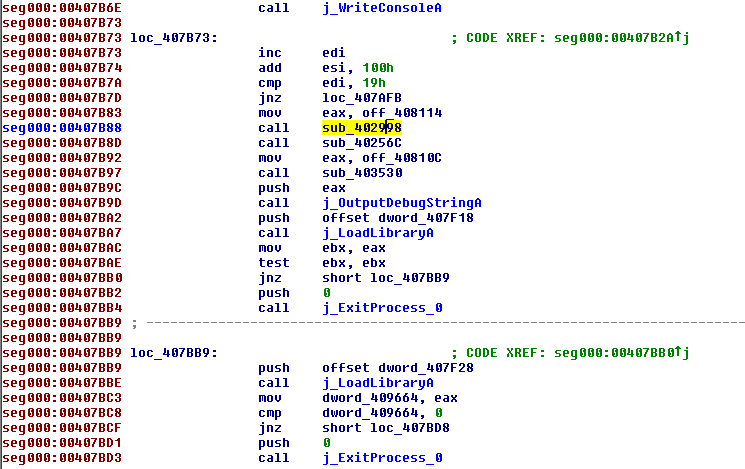
After writing the start up message to the console, the program immediately calls a subroutine located at 0x402998. This routine checks if we hit the ‘Enter’ key to continue. Once we hit the enter key, the program calls the subroutine on the next line. At first, I thought this was a TLS callback because I saw evidence of TlsIndex, and calls to TlsGetValue. There appears to be a place for a callback function. However, after hitting CTL-E in IDA, the only starting point I saw was the program’s starting point. I did not see evidence of a TlsCallbackEntry point. I did not spend too much time investigating this subroutine, but, whether a callback is called or not, it appears that the program makes calls to non-returnable functions. These functions eventually cause the program to wend its way to a FreeLibrary call and then eventually to an ExitProcess call. My guess is, that during the normal flow of the program, we call this routine and eventually terminate the program. This subroutine, however, does not prevent us from stepping over this function during a debug session. But if we do, notice that the program loads some value from location 0x40810C, and then calls OutPutDebugString. What do you bet, EAX contains that ‘s%s%s%s%s%s%s…” string sequence we saw in our string analysis in part one?

Sure enough, that is exactly what EAX contains. So, if we step over subroutine sub_40256C, and get to location 0x407BD92, then the program knows it must be in a debugger. It attempts to leverage an old OllyDbg vulnerability that will crash Olly. We can change EAX to 0 to get past that issue, or use a newer version of Olly, or IDA’s debugger.
After surviving our first anti-debugging trick, we now see that there are calls to LoadLibrary, but we don’t know the library’s name because it is disguised at offset dword_407F18:

I suspect, the authors are trying to hide the name of the library loaded. If we highlight, and hit the ‘a’ key, IDA will resolve the above array of numbers to an ASCII string:

We do this to all the obfuscated library names, and we can begin to see clearly what is being loaded:

URLMON and WININET libraries, functions for checking for Internet connections, and to download a file from some location. We also see strings for IsDebuggerPresent and scrolling down a little further we also calls to GetTickCount, and checks to the file segment fs:18h. These are all known techniques for checking to see if the program is in a debugger. If it is, the program can simply terminate the process leaving us high and dry.

We will need to deal with these anti-debugging techniques. Before we start debugging, lets continue our static analysis and scroll down to find some other interesting things such as:
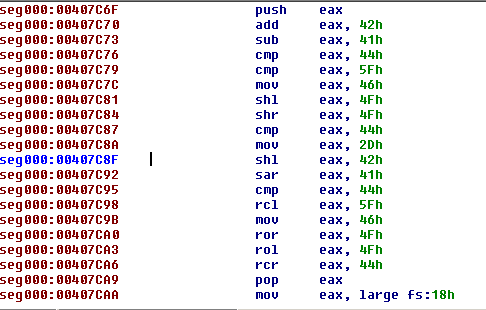
I am not sure what that is. Junk code? The hexidecimal digits look like ASCII symbols. If we highlight and press the ‘r’ key:

Interesting! A key of some sort? Scrolling further down, there are more checks for debugging and calls to GetTickCount, and jumps to ExitProcess if a debugger is detected. But eventually, we arrive to a series of code blocks that call WriteConsole. What other messages are there? Our next goal is to start the debugger, and when ever we come to a check for a debugger, change the jump value in the control flags to avoid ending the process. Lets see if we can get to these WriteConsole calls and see what these messages are.
After a couple of attempts, I finally get to the first WriteConsole call and we see the message:
Continuing, stepping through to the next WriteConsole call, we get our second message:
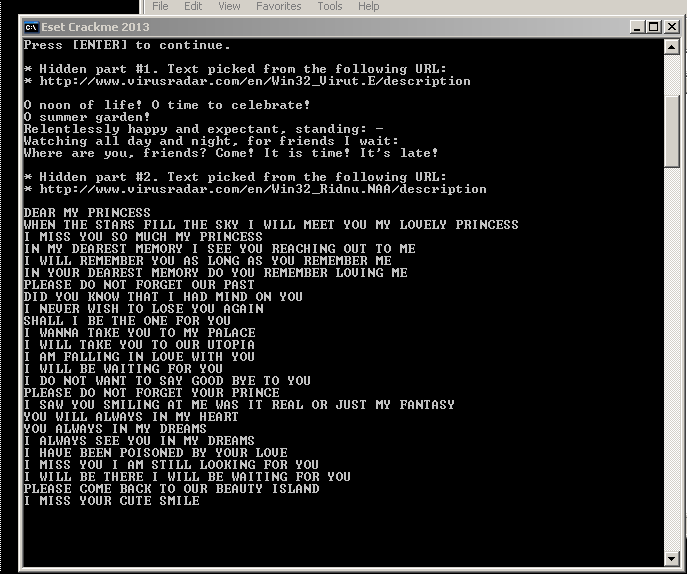
We continue stepping through to the third call to WriteConsole, and our third hidden message is revealed:
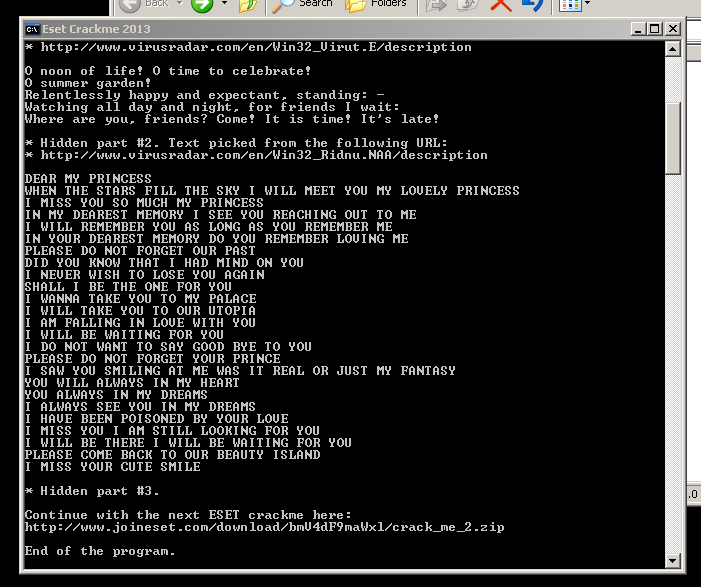
Looks like there is a second leg to our quest! Ok. We got pretty far today. It may be a good idea to re-run this program in our debugger, just like we did above, but this time run procmon and fakenet to see if this program did anything else behind the scenes such as write to the registry, and download any files.
This was a lot of fun and I learned some new tricks in IDA Pro that will be useful in my new position as a malware analyst and researcher. The next step is to visit the site, and get the second part of the challenge, and repeat the process. But that we will have to do another day.

Pingback: ESET Challenge Part 3 | Eric Hokanson
I am begginer and I have one question, why you didn’t analyse CALL on 0040465C?
this call to big function with API calls?
I did take a look at that routine, but it eventually winds its way to an exit routine. During the normal course of execution, this program displays a message to standard out and exits. Since this program had some hidden parts to it, I wanted to skip over the “exiting” routine to investigate these hidden messages or components. Note that we needed a debugger in order to skip over that routine;notice the anti-debugging checks after we skip. This struck me as interesting. Why would we have anti-debugging routines after a routine that seemingly wends its way to exiting? A common malware technique is to have an order of execution, if the malware detects any violations in its normal execution path, it can assume that it must be in a debugger and it can attempt to defend itself. Based on experience and a gut instinct, that was the path of investigation I chose. Keep practicing and you too will develop this “feel.”
Sweet blog! I found it while surfing around on Yahoo News.
Do you have any tips on how to get listed in Yahoo News?
I’ve been trying for a while but I never seem to get there!
Appreciate it
Thanks for thiis blog post